
Analytics for beginners: what to track & why
 Natallia Usava for Academy
Analytics scares people off for one reason: the dashboards show a hundred numbers and none of them tell you what to do. But a small business doesn't need a hundred numbers — it needs about six, and it needs to know what each one is telling it. This guide is the plain-English version: the handful of metrics that actually matter, why each one matters, and what to ignore so you don't drown. We'll finish with how to see them all in one place inside 🌱kvitly.
Tracking leads and customers too? See why your business needs CRM & automation.
The goal of analytics isn't to know everything — it's to answer one question: is what I'm doing working, and where do I lose people? Every metric below exists to answer part of that.
The funnel: the only mental model you need
Every business has the same basic path: people find you, they visit, they show interest, they buy, and some come back. That's the funnel. Analytics is just measuring how many people make it from each step to the next — and where the biggest drop-off is. Fix the biggest leak, and everything downstream improves. Keep that picture in mind and the metrics below stop being abstract.
The 6 metrics worth tracking
- Traffic (visitors) — how many people reach your site, and where they come from. Tells you if people can find you at all.
- Traffic sources — search, social, direct, referral. Tells you which channels are worth your time.
- Conversion rate — the share of visitors who do what you want (buy, sign up, book). The single most important number for most businesses.
- Bounce / engagement — do people stay and look around, or leave immediately? Flags a page that isn't delivering on its promise.
- Average order value — how much a customer spends per purchase. Small lifts here add up fast.
- Repeat / returning customers — how many buy again. Cheaper than finding new ones, and a sign you're actually delivering.
What to ignore (for now)
Vanity metrics feel good and change nothing. Total follower count, raw page views with no context, likes that never turn into visits — skip them until the six above are solid. A number is only worth tracking if a change in it would make you do something differently. If it wouldn't, it's a distraction.
Step 1. Pick your one north-star metric
Choose the single number that best represents your business working. For most small businesses selling online, that's conversion rate or number of sales. Everything else is context for that one. Having a north star stops you from reacting to every wiggle in every chart.
Step 2. Find your biggest leak
Walk the funnel and find the worst drop-off. Lots of visitors but few buyers? The problem is on the page, not in your traffic. Barely any visitors? Fix discovery first — SEO and channels — before touching the page. Analytics is most useful when it points you at the one thing to fix next, instead of everything at once.
Step 3. Change one thing and watch
Make one change aimed at that leak — a clearer headline, a simpler checkout, a better traffic source — and watch the metric for a week or two. One change at a time is the whole discipline; change five things and you'll never know which one worked. This is how analytics turns into decisions instead of just charts.
Seeing it all in one place with 🌱kvitly
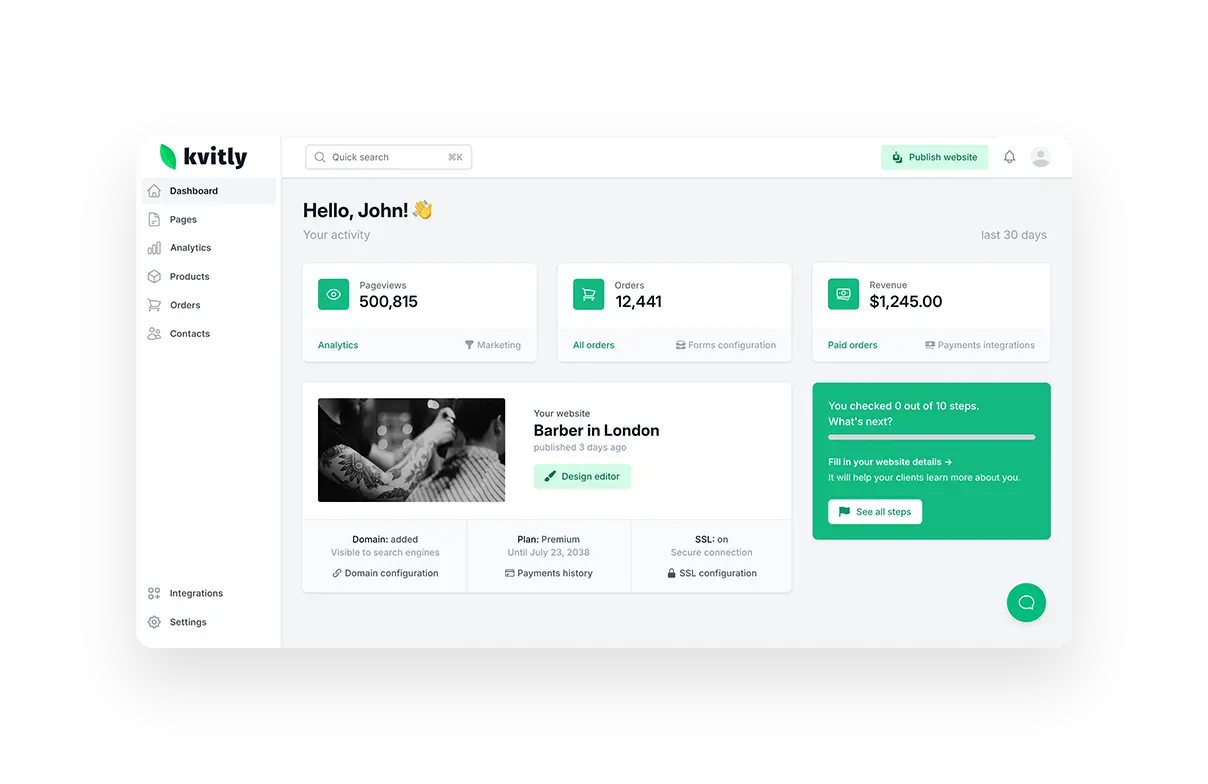
The usual beginner problem is that the numbers live in different tools: traffic in one analytics app, sales in the store, customers in a spreadsheet. You spend more time assembling the picture than reading it. Because 🌱kvitly runs your website, store, and CRM together, the funnel is already whole — visitors, conversions, orders, and repeat customers sit in one dashboard, tied to the same contacts. You can see where people drop off and act on it in the same place, and the AI assistant can help point out what's worth your attention. For a beginner, that's the difference between having analytics and actually using them.
Related reading
If your leak is discovery, start with the best tools for website SEO in 2026.
To tie those numbers to real customers, see how to integrate CRM, chat, and marketing in one place.
If the leak is on the page, read how to build a landing page that converts.
Frequently asked questions
What's the one metric a small business should track first?
Conversion rate — the share of visitors who take your key action. It combines whether your traffic is the right kind and whether your page persuades, so it's the fastest read on whether the business is working online.
What's a good conversion rate?
It varies a lot by industry, but 1–3% is a common starting range for e-commerce. Don't chase a benchmark — compare against your own past numbers and try to beat them. Your trend matters more than anyone else's average.
How often should I check my analytics?
Weekly is plenty for most small businesses. Daily invites overreacting to noise. Set a regular time, look at your north-star metric and the funnel, decide on one change, and get back to work.
Do I need a separate analytics tool?
You can add a dedicated one later for depth, but a beginner is usually better served by the built-in analytics in their platform, where traffic and sales already sit together. In 🌱kvitly the funnel is in one dashboard, so you don't have to stitch tools together to see it.
The bottom line
Analytics isn't about tracking everything — it's about tracking the six numbers that map your funnel, finding the biggest leak, and fixing one thing at a time. Do that and the charts turn into decisions. Try 🌱kvitly free for 14 days and see your whole funnel — traffic, conversions, and repeat customers — in one place.
Related articles

Natallia Usava
Head of 🌱kvitly. She commands time and a little space, knows everything about the needs of clients, loves to smile, and gets goosebumps at the sound of a cello.
Are you ready?
Explore 🌱kvitly with no limits within the trial period of 14 days. No commitment, no credit card required.
Let’s try!